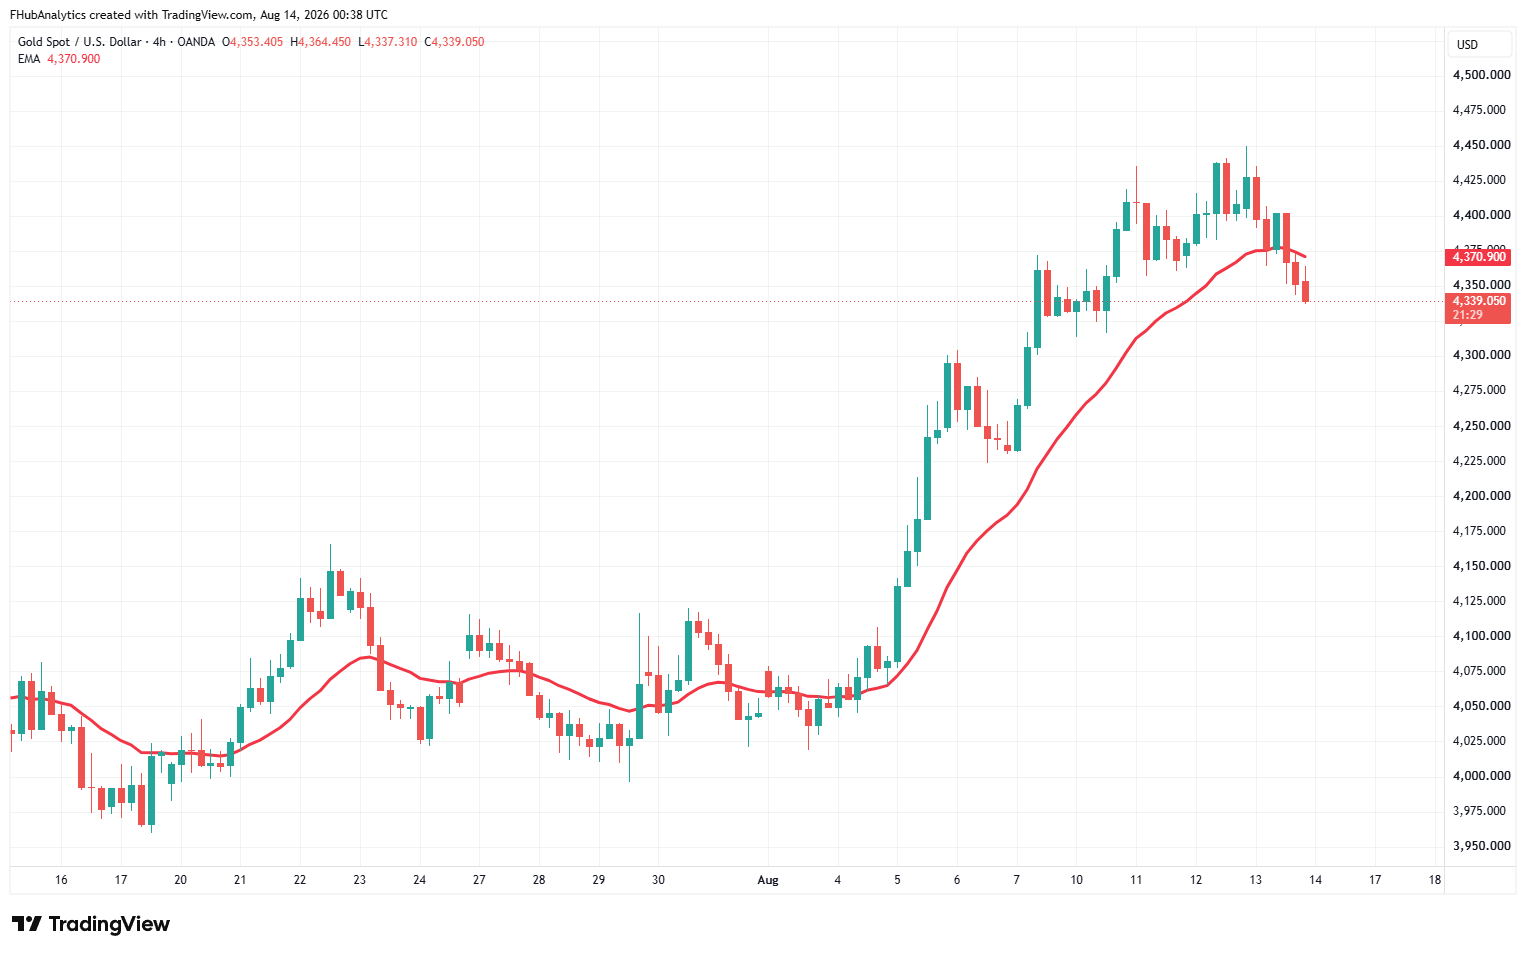
Gold had a wild ride this week. On Thursday, the precious metal spiked to a fresh two-month high of $4,449 during Asian trading hours, only to reverse hard as the US Dollar clawed back its earlier losses. By the time the New York session wrapped up, XAU/USD (Gold priced against the US Dollar) had slipped to around $4,365, down roughly 1% on the day, with an intraday low near $4,351.
The story didn't end there. In early Friday trading out of Asia, gold found its footing again, drifting back above $4,350 to trade near $4,360. The metal is still digesting a batch of softer-than-expected US inflation data released Thursday — data that's reshaping expectations for what the Federal Reserve (the US central bank, often just called "the Fed") will do next month.
Why Gold Whipsawed: Soft Inflation Meets a Recovering Dollar
The catalyst was Thursday's US Producer Price Index (PPI) report — a gauge of inflation at the wholesale level, before it reaches consumers. The headline PPI came in unchanged month-over-month in July, below the 0.2% increase economists had expected, and a step down from the prior year's annual rate, which eased from 5.5% to 4.7%. Core PPI (which strips out volatile food and energy prices) rose just 0.2% month-over-month, below the 0.3% forecast, with the annual rate slowing to 4.2% from 4.7% the month before.
Softer inflation data usually means less pressure on the Fed to raise interest rates — and lower rates tend to help gold, since gold pays no interest itself and becomes more attractive when other assets (like bonds) yield less. US Treasury yields did fall on the news: the 10-year yield dropped about four basis points to 4.647%, while the 2-year yield sank to around 4.14%, its lowest level since July 17.
But gold didn't get to keep all its gains. The US Dollar Index (DXY), which measures the dollar against six major currencies, trimmed its earlier losses and hovered close to the 100.00 level — later slipping below it. That partial dollar recovery, combined with profit-taking after gold's sharp run-up from near $4,000, pulled the metal back from its two-month peak. Weekly jobless claims also ticked up, from 200,000 to 209,000 for the week ending August 8, slightly above the 202,000 forecast — a sign the labor market is cooling, but not falling apart.
A Fed That Can't Agree With Itself
Adding to the uncertainty, Fed officials are openly split on what comes next. Cleveland Fed President Beth Hammack argued the US should raise rates to curb growth and inflation, noting businesses are eager to borrow for new investment — and that a rapid economic reacceleration could stall the progress made on cooling inflation. On the other side, Richmond Fed President Thomas Barkin called it an "open question" whether a hike is even needed, arguing current inflationary pressures stem from shocks that should fade on their own. Fed Chair Kevin Warsh is reportedly in the camp favoring steady rates.
That split showed up in how traders were pricing the odds. Earlier Thursday, money markets saw roughly a 40% chance of a rate hike versus a 60% chance the Fed holds steady. Later the same day, the CME FedWatch Tool showed the hike probability had dropped further to 32%, down sharply from 55% just a week earlier. By early Friday, traders had pushed the odds of any September hike down to under 40% overall — a general softening trend through the day, even if the exact number moved around session to session.
Iran, the Strait of Hormuz, and the Inflation Wildcard
Geopolitics is the other piece traders can't ignore. Tensions around the Strait of Hormuz — the narrow waterway that a huge share of the world's oil shipments passes through — remain unresolved. Iran's Foreign Minister Abbas Araghchi warned Washington to "be careful" after US President Donald Trump insisted the US has full control of the strait. Iran's military command went further, stating that no vessel could transit the waterway without Tehran's permission, and that the strait won't reopen unless the other side meets its commitments.
That standoff matters for gold because a prolonged disruption to oil flows could push energy prices — and inflation — higher, which complicates the Fed's calculus. Analysts at MUFG/BTMU flagged this directly, noting that the lack of progress reopening the strait, combined with elevated energy prices, continues to pose upside inflation risks in the near term. They also pointed out that unclear forward guidance from Fed Chair Warsh is making it harder for markets to read where policy is headed next.
The Technical Picture
On the charts, gold remains capped below its 100-day moving average, sitting near $4,385–$4,387, with the 200-day moving average further overhead around $4,500–$4,502. On the downside, the 50-day moving average near $4,145 is the first major support, with a deeper floor near $4,000. As of early Friday, the Relative Strength Index (RSI) — a momentum gauge — sat at 62.72, suggesting firm but not overheated bullish momentum. Earlier Thursday readings had RSI closer to 65, alongside a positive MACD reading, both pointing to underlying buying interest even as price consolidated.
What This Means for Gold
Gold's setup right now is a genuine tug-of-war. On one side, cooling US inflation data and falling Treasury yields are the kind of backdrop that typically supports higher gold prices — TD Securities noted that with the Fed likely on hold, gold should stay well-supported in its current elevated range even with some upside in energy prices. On the other side, a recovering Dollar, a divided Fed, and traders locking in profits after a sharp rally are all capping how far gold can run in the short term. The metal isn't breaking down — it's consolidating just below a key resistance zone while it waits for clearer signals.
What Traders Should Prepare For
Watch Friday's US Retail Sales report and the preliminary University of Michigan Consumer Sentiment reading — both could shift Fed rate-hike odds again.
Keep an eye on further Fed speakers; with officials openly split, any hawkish or dovish comment could move gold quickly.
Track developments around the Strait of Hormuz — any escalation or de-escalation directly affects energy prices and inflation expectations.
Watch the $4,387 level (100-day moving average) as the key resistance to clear; a break above opens the path toward $4,500.
On the downside, $4,145 (50-day moving average) and the psychological $4,000 level are the support zones to monitor if the pullback deepens.
Gold isn't breaking — it's breathing. A softer PPI print gives the bulls a reason to stay engaged, but until the Fed speaks with one voice and the Hormuz standoff resolves, expect price to keep testing $4,350–$4,400 rather than committing to a clean breakout.